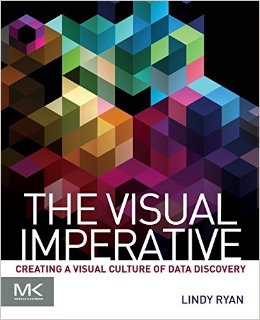
【内容简介】
Data is powerful. It separates leaders from laggards and it drives business disruption, transformation, and reinvention. Today’s most progressive companies are using the power of data to propel their industries into new areas of innovation, specialization, and optimization. The horsepower of new tools and technologies have provided more opportunities than ever to harness, integrate, and interact with massive amounts of disparate data for business insights and value – something that will only continue in the era of the Internet of Things. And, as a new breed of tech-savvy and digitally native knowledge workers rise to the ranks of data scientist and visual analyst, the needs and demands of the people working with data are changing, too.
The world of data is changing fast. And, it’s becoming more visual.
Visual insights are becoming increasingly dominant in information management, and with the reinvigorated role of data visualization, this imperative is a driving force to creating a visual culture of data discovery. The traditional standards of data visualizations are making way for richer, more robust and more advanced visualizations and new ways of seeing and interacting with data. However, while data visualization is a critical tool to exploring and understanding bigger and more diverse and dynamic data, by understanding and embracing our human hardwiring for visual communication and storytelling and properly incorporating key design principles and evolving best practices, we take the next step forward to transform data visualizations from tools into unique visual information assets.
【目录】
1. Separating Leaders from Laggards 2. Improved Agility and Insights through Visual Discovery 3. From Self-Service to Self-Sufficiency 4. Navigating Ethics in the Big Data Democracy 5. Data Science Education and Leadership Landscape 6. Visual Communication and Literacy 7. Visual Data Storytelling 8. The Importance of Visual Design 9. The Data Viz Continuum: Exploratory, Explanatory, Infographics, & Iconography 10. Architecting for Discovery 11. Data Visualization as a Core Competency 12. Enabling Visual Data Discovery by Design 13. Visualization in the Internet of Things

 新书报道
新书报道